Coronagraph imagery, sunspot region 2297
Friday, 13 March 2015 17:10 UTC
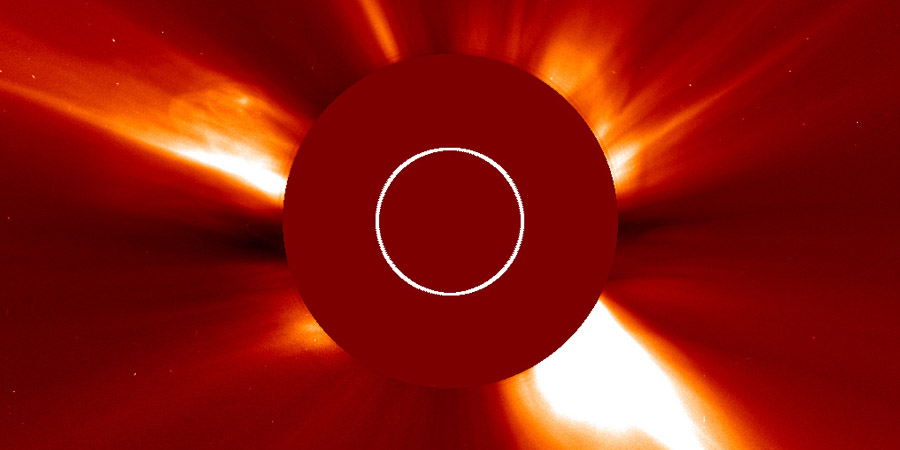
SOHO imagery is now available until 03:00 UTC today and this gives us finally the opportunity to take a look at the coronal mass ejections released by the X2.2 solar flare from 2 days ago and of course the countless of other M-class events that took place the past few days.
Let's just give it to you right away: there is NO ejecta on the Sun-Earth line from the X2.2 event. A very minor and small coronal mass ejection was launched heading east but it is really nothing to write home about. There is no halo signature to be seen and all in all this is just a very minor CME.
While skipping trough the rest of the available imagery, there are again no obviously earth-directed coronal mass ejections to be seen. Not a single one of these solar flares seem to have launched a CME on the Sun-Earth line. Even the coronal mass ejection of a filament eruption that took place near the NNW limb also does not look to be earth-directed.
These events again shows how important SOHO/LASCO imagery is. You can never be sure on how a coronal mass ejection looks like without imagery from SOHO.
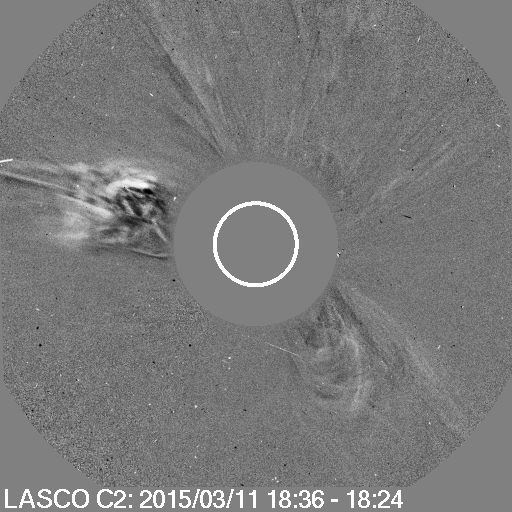
Image: The coronal mass ejection launched by the X2.2 solar flare can be seen heading well east of Earth on this image from SOHO.
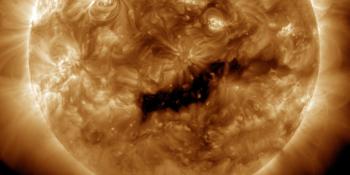
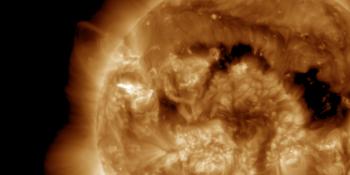
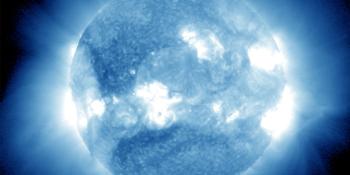
Sunspot region 2297
Solar activity decreased to moderate levels since our last report with three low-level (R1) M-class solar flares. Yesterday we had an M2.7 solar flare at 21:51 UTC and today there was an M1.2 solar flare at 04:01 UTC and an M1.8 solar flare at 06:07 UTC. Can we find an explanation why the activity around this sunspot region decreased to lower levels?
Well... the bad news is that sunspot region 2297 showed signs of decay. While it did not decay a whole lot, it clearly did loose some spots and a bit of penumbral mass both near the trailing delta structures and among the leading sunspots, along with more seperation between the leading and trailing sunspots. It keeps a couple of tightly packed delta sunspots so there remains a chance for another moderate to strong solar flare, but the chances did decrease a bit because of the decay mentioned earlier.
M-class flare probability for the coming 24 hours: 70% chance
X-class flare probability for the coming 24 hours: 20% chance
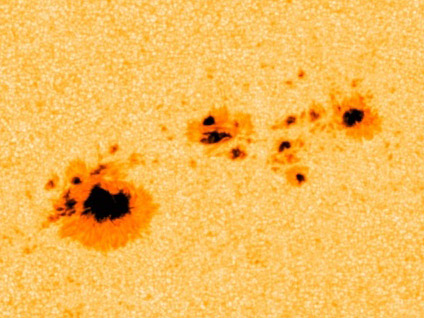
Image: Sunspot region 2297 as seen by NASA SDO.
Thank you for reading this article! Did you have any trouble with the technical terms used in this article? Our help section is the place to be where you can find in-depth articles, a FAQ and a list with common abbreviations. Still puzzled? Just post on our forum where we will help you the best we can!
Latest news
Latest forum messages
Support SpaceWeatherLive.com!
A lot of people come to SpaceWeatherLive to follow the Sun's activity or if there is aurora to be seen, but with more traffic comes higher server costs. Consider a donation if you enjoy SpaceWeatherLive so we can keep the website online!

Space weather facts
| Last X-flare | 2025/01/04 | X1.85 |
| Last M-flare | 2025/01/22 | M1.3 |
| Last geomagnetic storm | 2025/01/04 | Kp5 (G1) |
| Spotless days | |
|---|---|
| Last spotless day | 2022/06/08 |
| Monthly mean Sunspot Number | |
|---|---|
| December 2024 | 154.5 +2 |
| January 2025 | 145.8 -8.7 |
| Last 30 days | 161.9 +43 |
